
Most cash flow forecasts are wrong by Tuesday. By Thursday they have nothing useful to say, and by Friday you are taking the funding call with your bank on instinct. The forecast became a record of what happened, not a guide for what to do next.
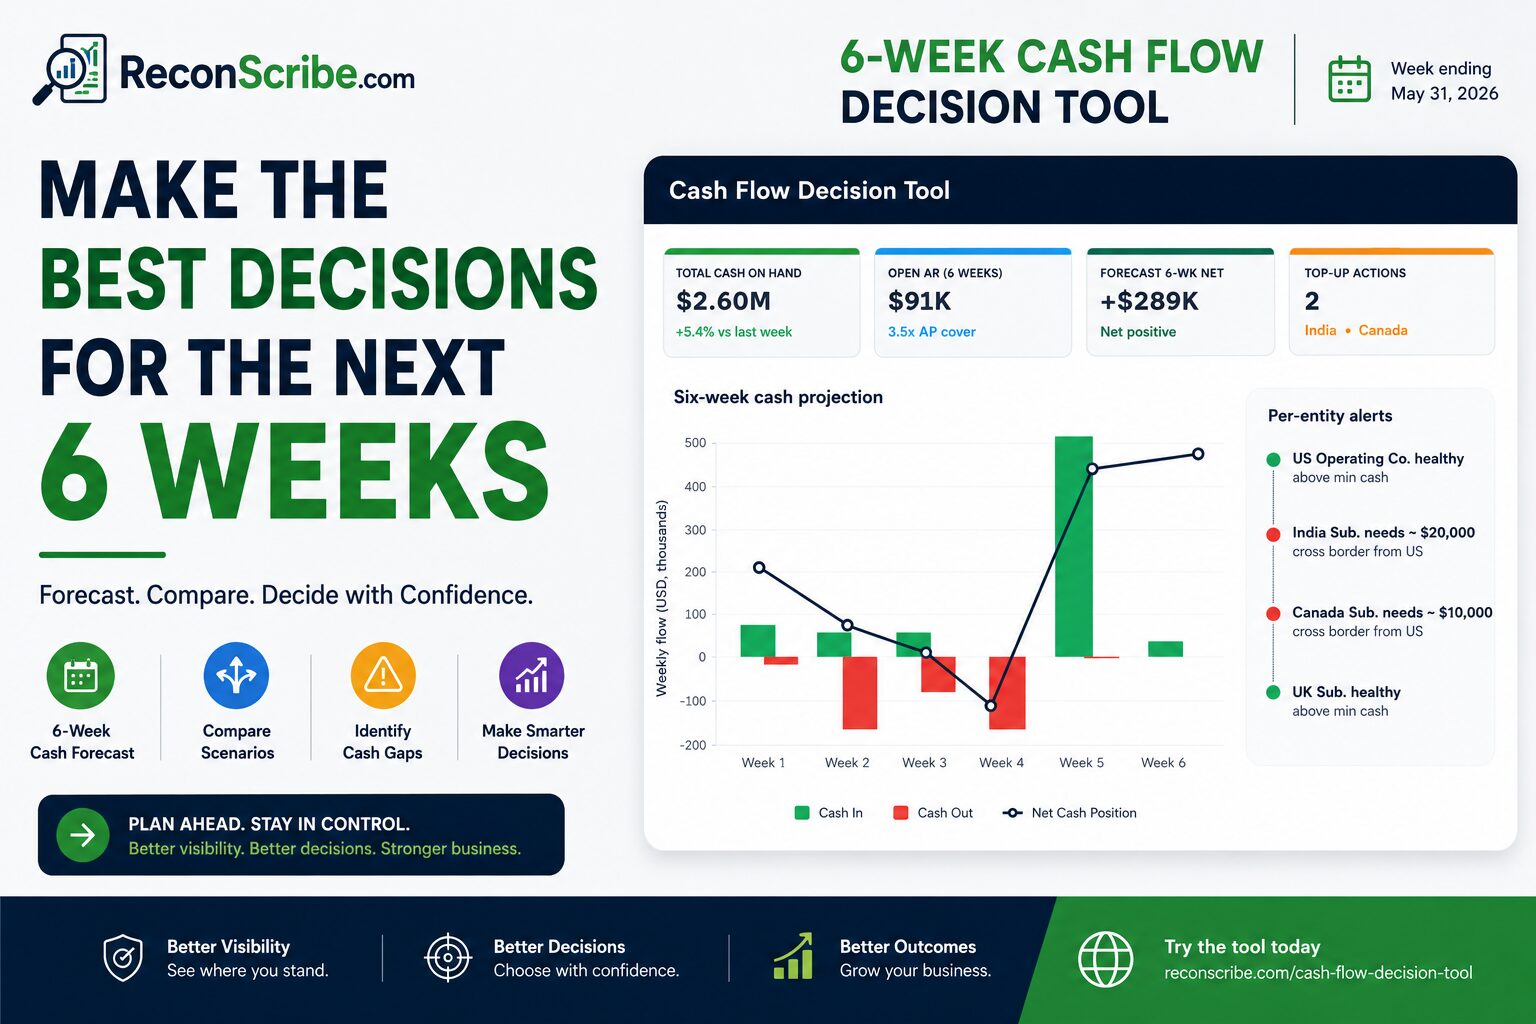
The Cash Flow Decision Tool is built around a different question. Instead of “what will the bank balance look like”, it asks “what should we actually do this week”. The six weekly columns are not a vanity number. They are decision points, and the entire workbook is wired to surface the next moves you can take with the cash you already have.
You can download the template at the bottom of this article. It is a single .xlsx file, no macros, no external connections, and no online services to authorize. It opens in Excel, Numbers, and Google Sheets, and the formulas are unprotected with one password if you ever want to restructure them.
Managing operational liquidity is a critical challenge. If you need a reliable free cash flow forecast template Excel spreadsheet or want to implement a simple cash flow forecast template for your team, the Cash Flow Decision Tool serves as a complete cash flow projection template Excel solution. It functions as a lightweight small business cash flow template that helps you stress-test your numbers and avoid cash crunches.
Why six weeks, not thirteen
Treasurers love the 13 week cash flow forecast because it lets you see one full quarter. That is great for institutional reporting. It is overkill for an operating decision today.
If you are running a startup, an agency, a clinic, or a mid-sized services business, your real questions are tighter:
- Will payroll clear next Friday on its own, or do we need to pull a draw on the line of credit?
- Should we wait for two large receivables, or pay an aggressive vendor early to keep the relationship warm?
- Can we send an inter-company transfer to the India sub without pushing US Operating below its minimum cash floor?
Those are six-week questions. Past week six the data is too soft to act on, and the modelling effort is wasted. Six weeks is the operational sweet spot. It covers two payroll cycles for most companies, includes any quarter-end one-offs that are this close, and forces a fresh look every Monday morning.
What this tool does that a normal forecast does not
A normal forecast ends at “closing balance”. The Cash Flow Decision Tool starts there and adds the layer you actually need: per-entity threshold logic.
Each subsidiary or division has a minimum cash level, set in the Settings sheet. When the projected closing balance drops below that floor, the Dashboard fires a top-up alert that tells you the deficit, rounds it to the nearest funding step, and labels the source of the cash. If you run one entity, leave it on default. If you run five (US parent plus India, Canada, UK, and Singapore subs, for example), the alerts surface every single one in one view.
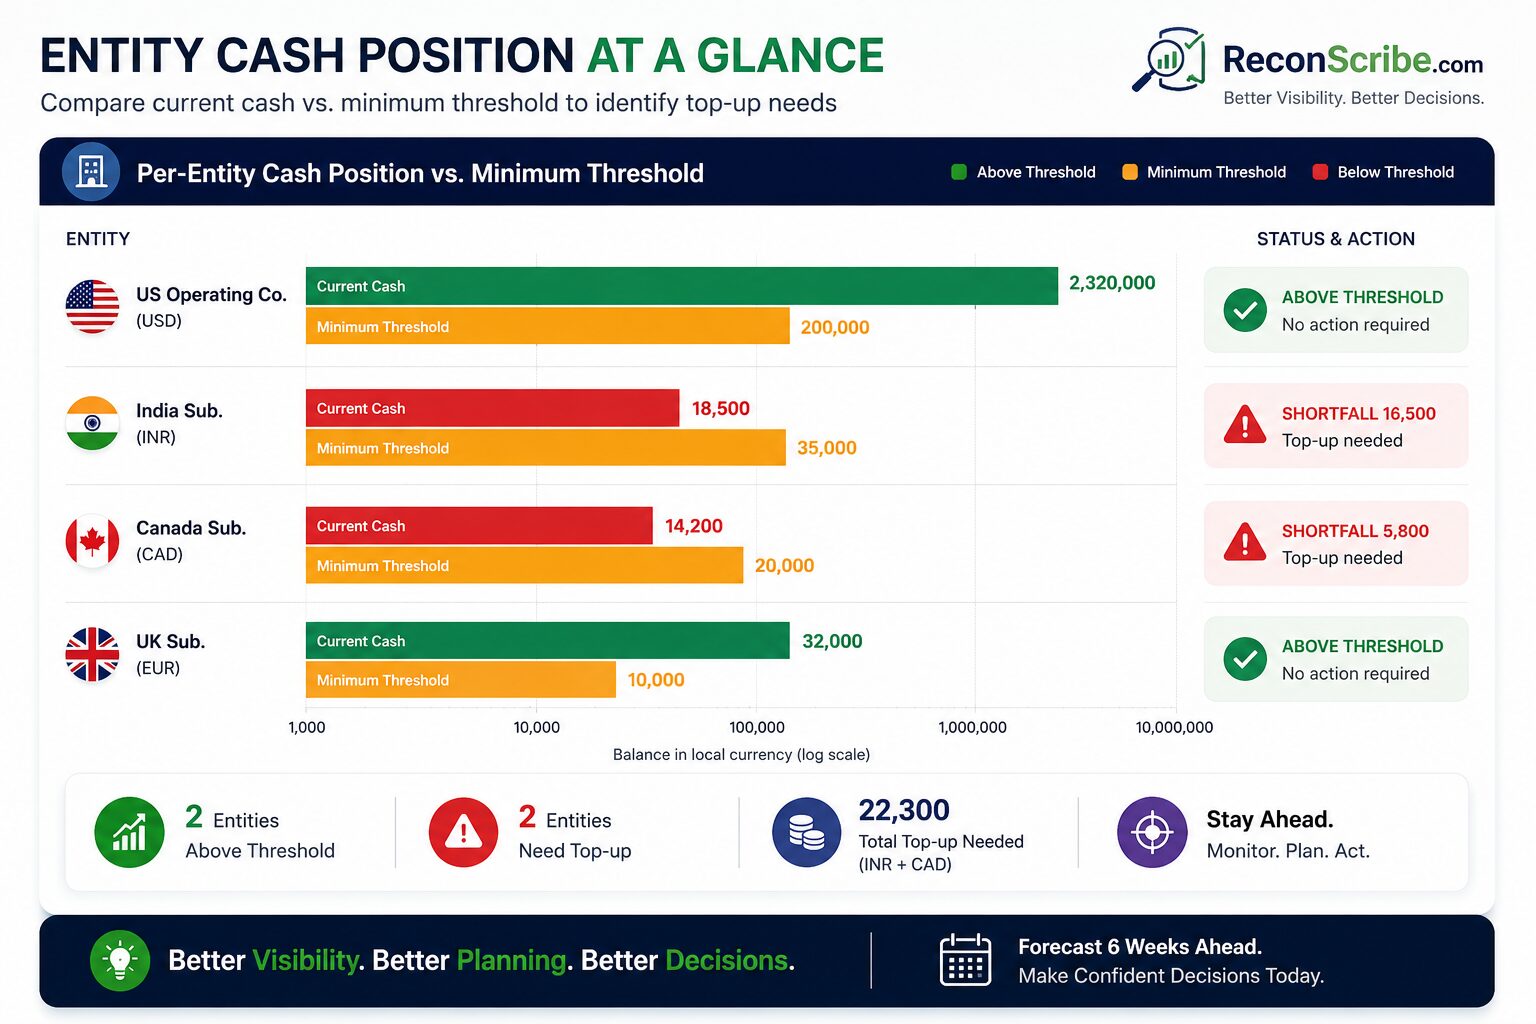
This single pattern, the threshold alert, is why the Cash Flow Decision Tool is different from a normal forecast. The forecast tells you the future. The tool tells you what to move, how much, and from where.
The eight-step weekly workflow
Roll the file forward each Monday in about twenty minutes:
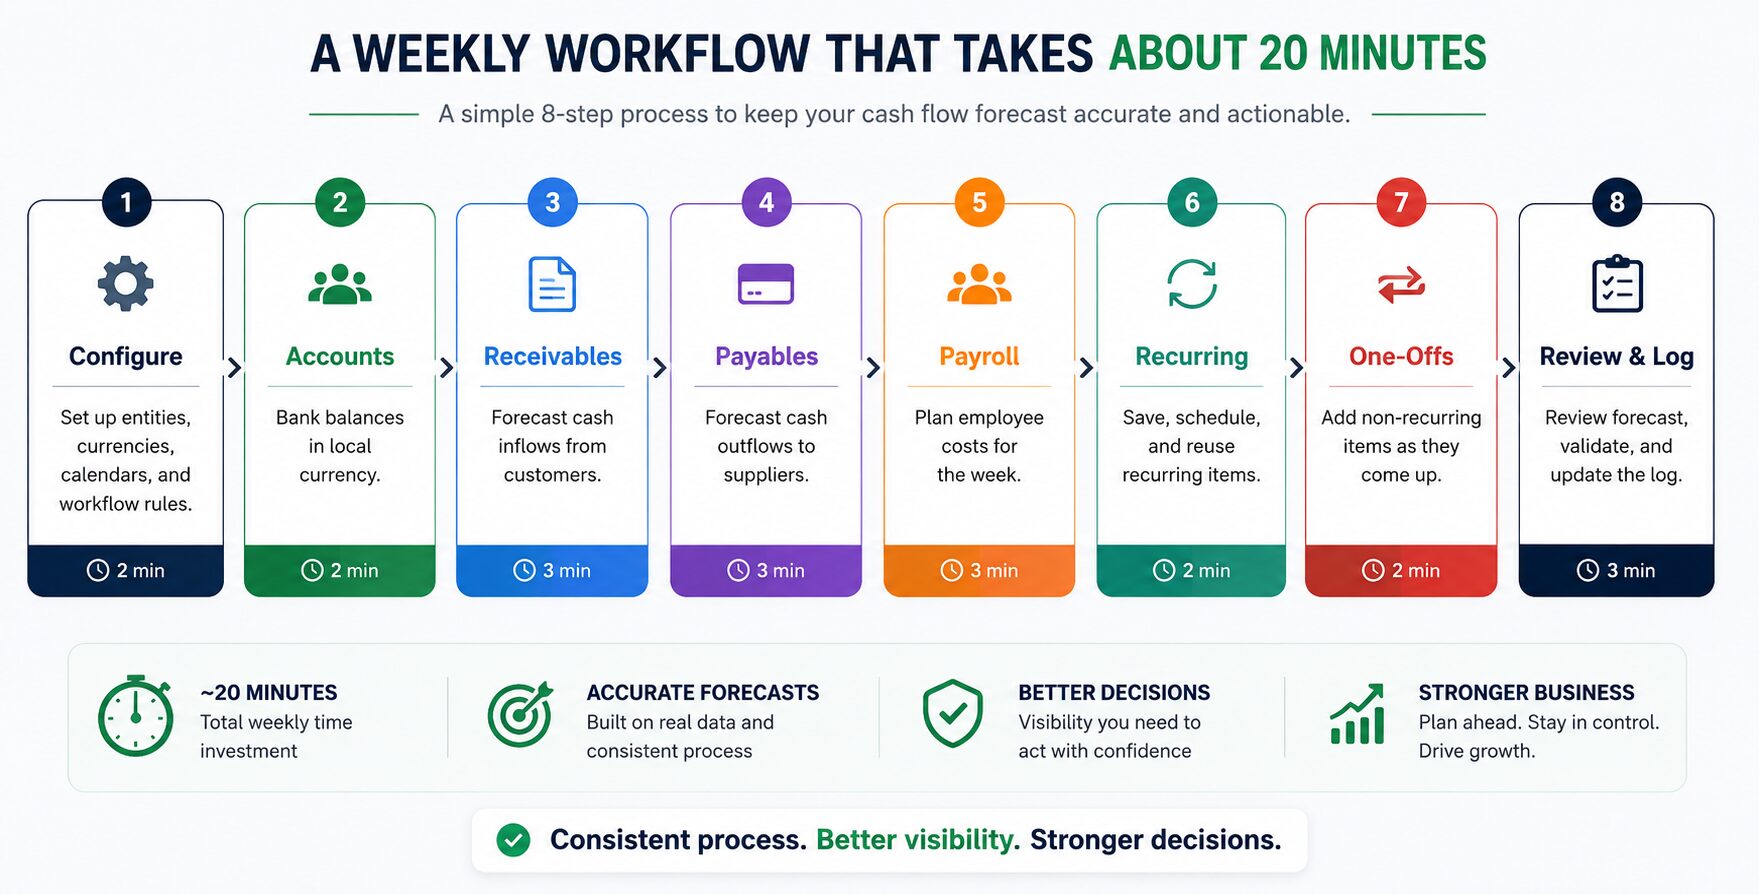
- Update the Forecast Start date in Settings to the Monday of the current week. Everything downstream re-buckets automatically.
- Refresh bank balances on the Accounts sheet, in local currency. Update FX rates in Settings if the spread has moved.
- Paste open receivables. Drop each invoice into a week bucket using the yellow dropdown. Use “Not Sure” for anything you cannot place; the Dashboard ignores those for now, and you can sweep them later.
- Paste open payables. Anything overdue defaults to Week 1. Use the same yellow dropdown to push less critical bills out.
- Set payroll runs by entity, by week. Most companies have a fixed payroll cadence, so this is a five-second update once the columns are populated.
- Confirm recurring outflows: rent, SaaS, insurance, intercompany service fees.
- Add one-offs: tax payments, asset sales, a fundraise tranche, an equipment purchase, a settlement.
- Read the Dashboard in this order: alert list, six-week net, lowest closing balance in the horizon, top five outflows in Week 1. If you need to act, act. Then log last week’s variance in the Variance Log.
The whole sequence is twenty minutes once the file is set up, and the structure repeats every Monday until it becomes the most boring part of your week (which is the point).
Stress-testing in three clicks
Plans break in two predictable ways: customers pay slower than booked, and you have to release payments earlier than you wanted. The Scenarios sheet handles both by shifting two levers at once, the collection percentage and the payment timing offset, and shows you the six-week closing balance under Best, Base, and Worst.
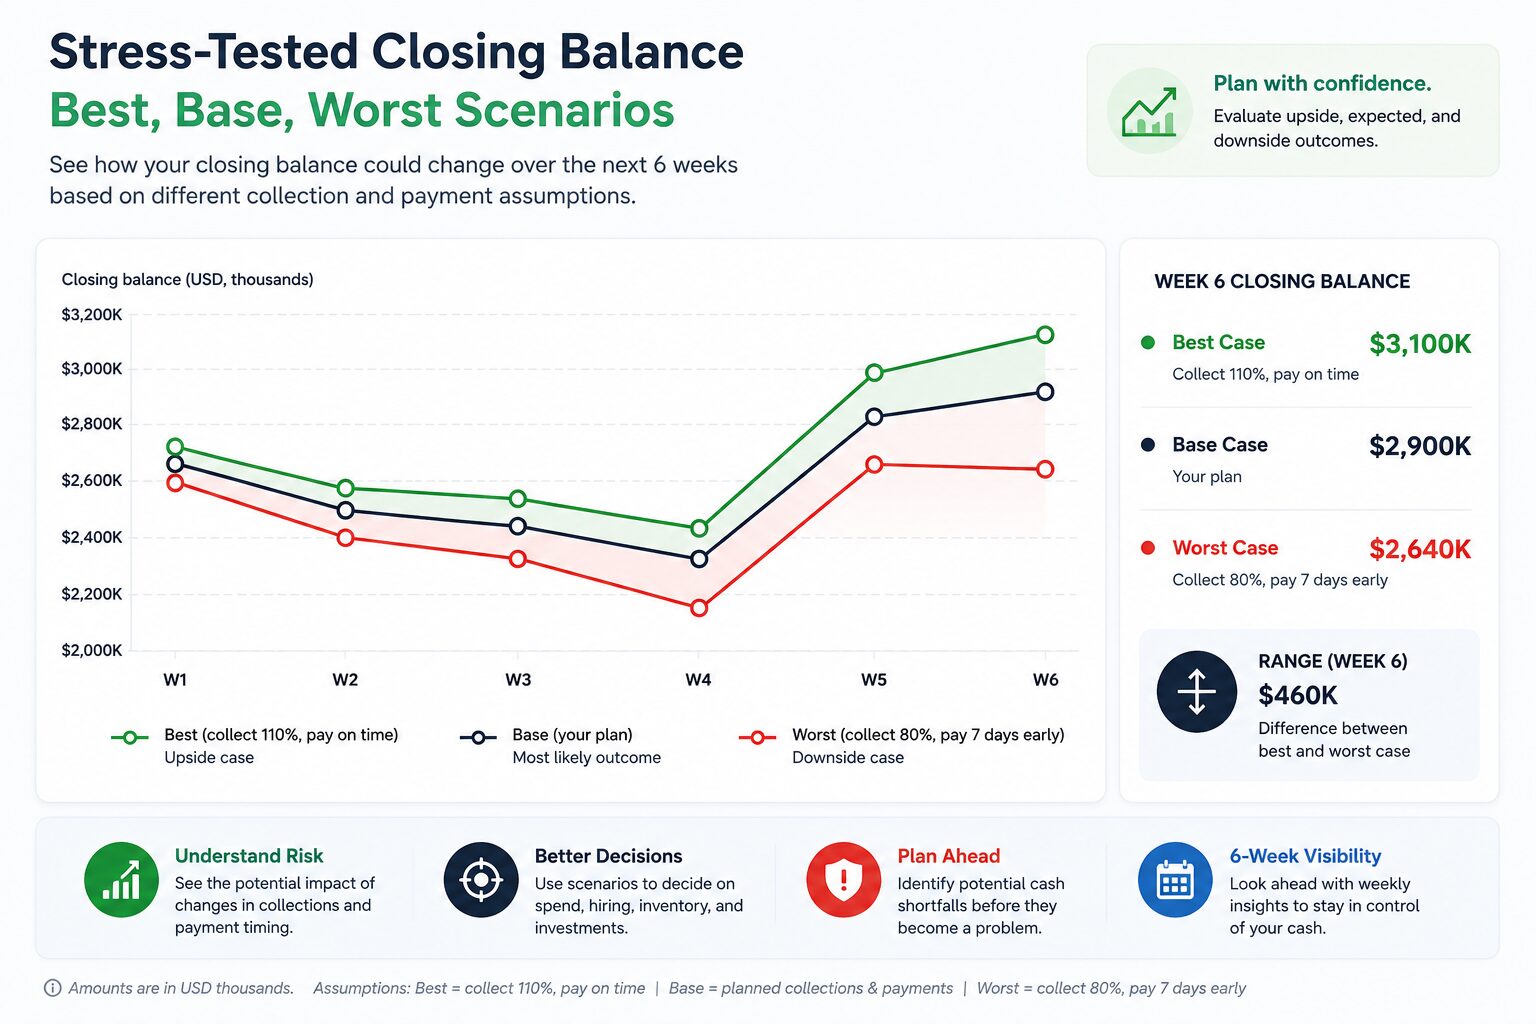
Best assumes you collect a little more than booked and pay on the day each invoice is due. Worst assumes you collect 80% and pay seven days early to keep vendors happy. Base is your plan. The visual gap between the three lines is your buffer, and it is usually a more honest answer to “how risky is this month” than any single number on the Dashboard.
Multi-currency, multi-entity, one reporting view
Every entity holds cash in its local currency. The tool stores those local balances on the Accounts sheet and converts them to your reporting currency on the Dashboard using FX rates you control in Settings. INR, CAD, EUR, GBP, AUD, SGD, and USD ship with the file. Other currencies plug in by adding a row.
The Dashboard headline numbers reformat live when you change the number style. US standard (1,234,567), Indian lakh format (12,34,567), millions abbreviation, European format, and plain are all one dropdown. If you are reporting to investors in San Francisco and operating teams in Bangalore at the same time, this is the difference between two files and one.
The Variance Log catches drift before it kills you
The single most useful sheet, and the one most people skip, is the Variance Log. At the end of each week you write down the closing balance you forecasted last Monday and the closing balance you actually hit on Friday. The delta is your error.
Over six to eight weeks of logging, two things become obvious:
- The structural bias in your forecast. Most teams overestimate collections by about six to twelve percent every week. The Variance Log will show you that bias as a steady negative number.
- The line items that drift most. For some companies it is payroll timing. For others it is a single slow-paying customer that should be moved to the “Not Sure” bucket by default.
A small correction in next week’s forecast, based on a real variance number from this week, is worth more than any model upgrade.
Why this is an offline .xlsx and not a SaaS
Spreadsheets are still the right answer for weekly cash flow work, and the reasons are practical:
- You can email the file to a co-founder or a board member without provisioning anything.
- The formulas are visible. If your CFO disagrees with how the runway is computed, they can read the cell and argue with it.
- There is no vendor risk. The tool keeps working in 2030.
- It opens in Excel, Numbers, and Google Sheets, with no macros that trigger security warnings or break in the browser.
The tradeoffs are real: no automatic bank feed, no scheduled refresh, no live team collaboration without a shared drive. For weekly cash decisions in a single-person finance function, those tradeoffs are usually worth it. Move to a SaaS treasury system when you outgrow this, not before.
While managing cash flow offline keeps you in control, you can also automate other parts of your finance stack. If you want to streamline your back-office operations, check out our guide on AI tax automation to learn how machine learning is reshaping tax compliance.
Who this template is built for
The shape of the file matches a few specific situations:
- Founders and finance leads at startups under USD 50M in revenue who run lean and need a weekly view of cash.
- Multi-entity founders running a US parent plus one or two foreign subs, who care about per-entity thresholds and intercompany transfers.
- Agencies and services firms where receivables are lumpy and a single delayed invoice can swing the week.
- Operators preparing for a fundraise who want a credible, defensible six-week view to put in a data room.
- Treasurers at mid-market businesses who want a lightweight planning artifact alongside their ERP.
It is not for everyone. If you are running a public-company close, you want SAP. If you are running a corner cafe, this is more structure than you need. For the lane in the middle, which is where most operators live, the file does the job.
How to customise it for your business
The Settings sheet drives almost everything. Update these fields and the rest of the workbook reshapes around them:
- Company Name and Reporting Currency. The Dashboard title and all headline numbers reflow.
- Forecast Start. Set to the Monday of the current week. All six weekly columns rebuild from this date.
- Entities. Add up to five. Each gets a country, a local currency, a minimum cash threshold, and a labelled top-up source.
- FX Rates. Refresh weekly. The samples column shows you what 1,000 units of local currency convert to in your reporting currency, so a wrong rate is obvious.
- Top-up calculation. Rounding step and safety buffer control how the suggested top-up amount is calculated.
Modules you do not need, such as Recurring, One-Offs, or Scenarios, can stay empty and the Dashboard still works. There is no all-or-nothing setup.
Get the template
The download is gated to keep the user list real. Sign in or create a free account, and the file streams to your browser as a single .xlsx. Subscribers get the refreshed version automatically when we update the template, and we do not email anything else.
See all our free tax calculators and tools
Frequently asked questions
Does this cash flow template need macros?
No. The file is pure formulas. It runs in Excel desktop, Excel Online, Google Sheets, and Apple Numbers without enabling anything. There is no VBA, no Power Query, and no external connections that need re-authorizing.
Can I extend it to a 13-week cash flow forecast?
Yes, but the file is intentionally fixed at six weeks. Extending it requires unprotecting the Dashboard and Scenarios sheets using the password in the Start Here tab, then extending the column references. Most users find the discipline of a six-week horizon more valuable than the extra weeks of low-signal forecasting.
What if my reporting currency is not USD?
Set the Reporting Currency field on the Settings sheet. INR, EUR, GBP, CAD, AUD, and SGD are pre-wired with sample FX rates. For anything else, add a row to the FX table with the conversion rate. The Dashboard rebuilds automatically.
Does the template integrate with QuickBooks, Xero, or NetSuite?
The template does not pull from any system, by design. The workflow assumes you copy and paste an AR aging detail and an AP aging detail at the start of the week. Most accounting platforms export both as Excel in one click, so the paste step takes seconds.
How do I share the file with my CFO without breaking the formulas?
Excel’s protect-and-share controls are already in place. Blue cells are unlocked input cells. Everything else is locked. Anyone can edit inputs without touching formulas. The unlock password lives in the Start Here tab if a real structural change is needed.
How often should I refresh the file?
Every Monday morning. The point of the six-week window is that it works as a weekly cadence. Slower than that, you fall behind. Faster than that, you over-engineer.
Is the Cash Flow Decision Tool free for commercial use?
Yes, the Cash Flow Decision Tool is free for commercial use. Use it inside your business, share it with your CFO or board, and adapt it however you like. We only ask that you do not republish or resell the unmodified file as your own product.
If you also track annual insurance, software licences or AMC contracts, our prepaid expense schedule template automates the monthly amortisation the same way this forecast automates your cash flow.